-
Goethe’s Colour Spectra.
Posted on November 8th, 2014 No commentsYesterday, 7th November 2014 I was searching Google Images for suitable photographic images to add into my post “Williams’ Pin Prism, and Fraunhofer Lines.”. This was not an easy task because most images do not show the true visual evidence and are more computer graphics than reality. However, the task was definitely worthwhile, because I came across an image originally produced by Johann Wolfgang von Goethe. (1749 – 1832)
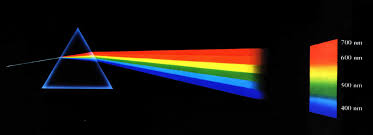
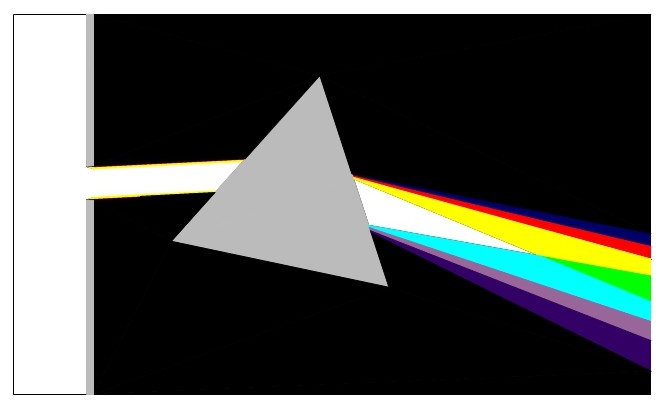
Most modern images are similar to the ones below.
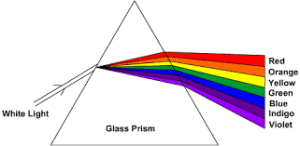

These images are totally against the reality of what happens with prism spectra, and I find it very annoying , especially when being used to teach people.
Note; I have been sent this video clip from a reader who asked me to explain it.
http://www.youtube.com/watch?v=7Fl0GZsBhGo&NR=1
I am afraid that the contents of it demonstrate the poor teaching and lack of honesty in modern physics.
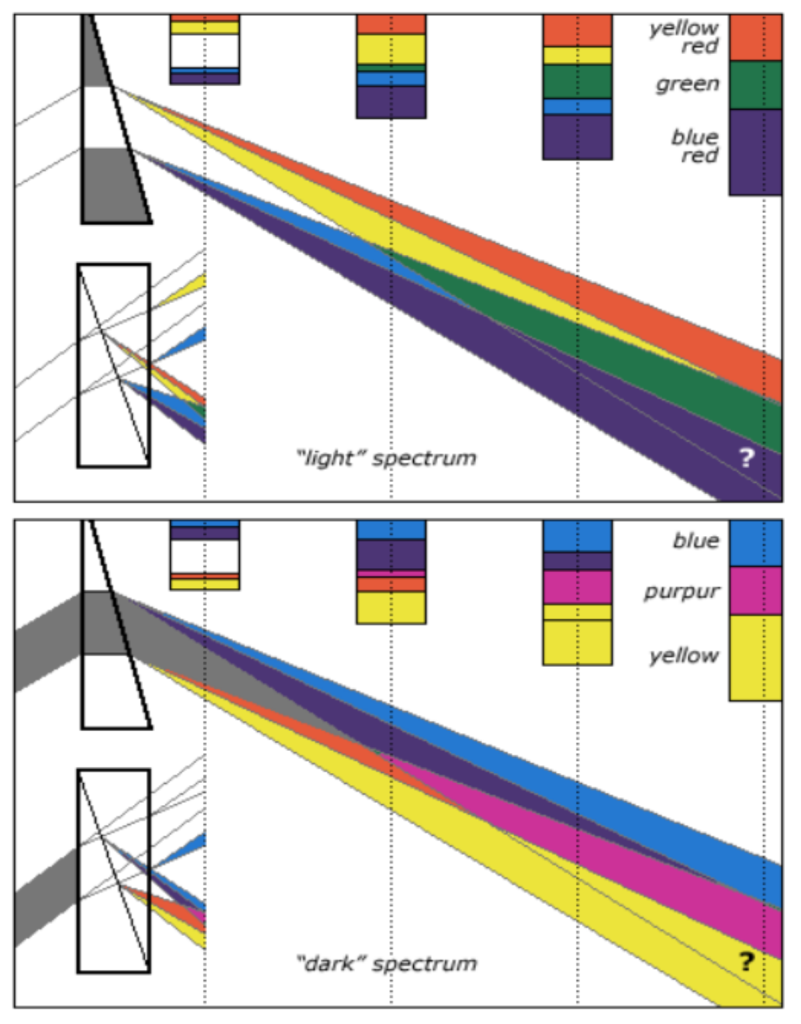
The drawings below, originally created by Goethe. and re-created by www.handprint.com are very close to the actual/true situation. His method/style used is identical to that used by myself, so he definitely beat me to it.
 handprint : goethe’s “zur farbenlehre” www.handprint.com380 × 555Search by image
“light” and “dark” spectral mixtures from. Goethe’s “primordial” fringes adapted from Plate IV, Figures 1 and 2 and ¶214-¶216 of Zur Farbenlehre (1810)
I assume that the above colours are based on the actual colours seen in the original book, which will have faded. In the top picture the Green shown should be a very bright Green.
The lighter Blue should be Cyan.
Where the question mark is, this area should be a dark Green.
The top picture (“Light” spectrum) is what I refer to as an “Expansion Spectrum”.
The bottom picture (Dark” spectrum) is what I refer to as a “Compression Spectrum”.
In this picture, where the question mark is, this area should actually be very pale Mauve or White. “Purpur” should actually be Magenta. Magenta only occurs in compression spectra and Greens only occur in expansion spectra.
Note; It is the slit, (that constricts the light into a beam), that actually creates the colours. The White beam entering the prism has thin Yellow + Red + Blue edges to it. This is why the colours start at edge of the spectra exiting the prism, as shown in the above drawings. What is missing from the top drawing is the dark Blue band. Its energy is measurable and is named “Infra Red” due to lack of knowledge, by the physicists. It is missed because this ‘true’ spectra Blue is very dark and is ‘lost’ against the dark background. The lighter Blues are a mixture of either Blue and White or Blue and Red.
In the drawing below, the left hand side (White) is the source of the light. This light passes through an aperture (Slit) and shines onto the prism.
 In passing through aperture, narrow coloured edges are created on each side of the beam of light. These edges are composed of three colour bands, Blue on the outer edge, Red in the middle and Yellow on the inside These edges are created by the Laws of Fluid Mechanics. If you look under “Orifices” in your text book on Fluid Mechanics, all should be explained.
See also my “Taper Slit Experiment” and my “Taper Silhouette Experiment.
Author – Brian Williams
-
Colour – Williams’ Taper Silhouette Experiment
Posted on November 22nd, 2009 No comments.
For our second experiment we use a tapered silhouette as shown.

If you view this silhouette through a prism you will see a spectrum as shown below.

In the above view the Blue and Red bands are forced into occupying the same space, therefore the combined energy plus some turbulence gives us Magenta. Where you would expect Green i.e. where the Blue and Yellow bands cross, you have the extra energy of the Red light in the Magenta which is being squeezed into the same area. This forces the total energy back into White. This I refer to as a ‘compression spectrum’.
It should be remembered that in the slit experiment the light can expand into the dark area. In the silhouette the colour bands are under pressure from the surrounding White light. Regarding the hypothesis that Yellow light is a combination of Red light and Green light, there is no evidence of any Green light. If there was a Green band between the Yellow band and the surrounding White I might have been interested in the hypothesis.
Note: Light acts in exactly the same way as any fluid, and follows the laws of fluid dynamics.
Abstract from Physics or Fantasy – Section 2 – Colour and the Quantum Theory
See also Williams’ Taper Slit experiment