

-
Energy of Coloured Light
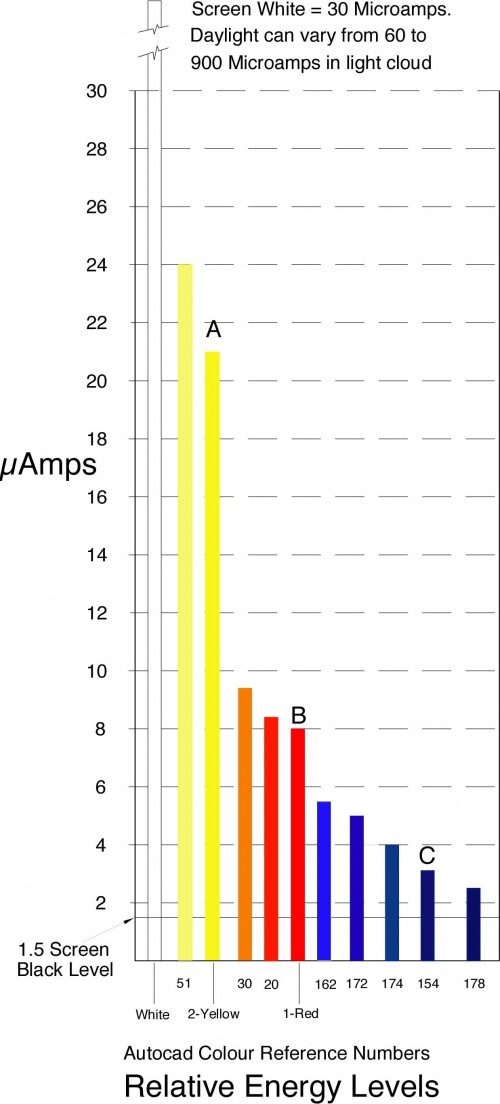
Posted on October 11th, 2010 No commentsAbout 12 years ago I carried out this simple experiment to assess the energy of coloured light. I connected a photocell to a micro-ammeter and mounted them in front of my computer. I then set up a rectangle in Autocad with a fill colour and zoomed in to give a full screen colour. I then took readings from different screen colours.
The chart below shows the readings obtained. Note;- This is a short version, I am still having difficulty with transferring the larger one which gives far more colours. I will add this when I have sorted the problem out.
This is a very crude experiment and is only approximate. I have 4 computers and the colours show considerable differences on each.
The colours marked A, B and C are the primary colours as seen though a prism, when viewing a wide slit.
I compared these using another prism when taking the readings, and the Red and Yellow are very close, but the Blue is more difficult to determine. This post has been produced on Ubuntu Linux with the drawing done on my old Apple 8500 server. The Blues on the Linux appear a lot lighter.
I checked the energy for a Black screen which gave a reading of 1.5 micro-Amps. This additional energy probably accounts for the difficulties in establishing readings particularly in the low energy range of colours.
Varying the energy level of the White light did not effect the energy levels of the primary colours Yellow, Red, and Blue, marked A, B and C on the chart or its perceived colour.
It did affect the paler Reds and paler Blues indicating that they needed White light to obtain their different colours.
MORE to come on this.
Author – Brian Williams