-
The Full Mathematics of the Michelson – Morley Experiment. Part 1
Posted on November 28th, 2014 No commentsI have never understood why the physics establishment decided that time differences were relevant to the Michelson – Morley experiment. I first looked at this about 48 years ago and my first thoughts were that there could not be any time differences. I am now absolutely certain. The actual results obtained from the experiment are exactly in accordance with the laws and mathematics of classical mechanics.
Basic Set-up of the Experiment.
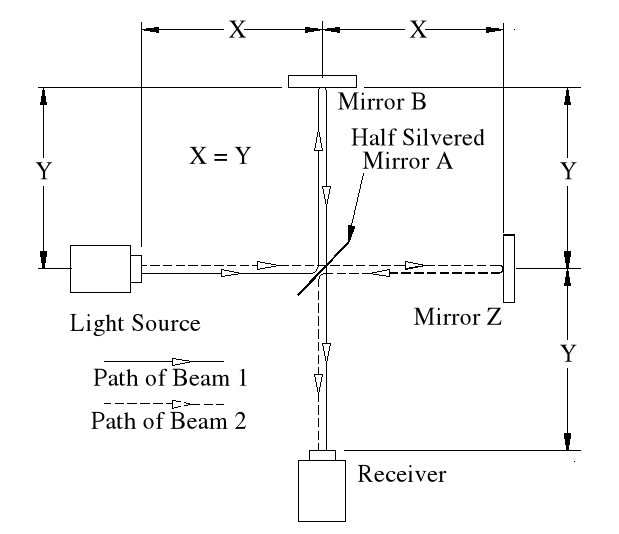
Basic Set-up of the Michelson – Morley Experiment
The idea behind this experiment, dreamed up by Michelson & Morley, was that somehow it would enable them to detect the motion of the Earth in space, (or relative to a fixed point in space), and that it could be detected by differences in the time taken for two beams, travelling different paths, both identical in length. No differences were observed. Note that the physicists assumed that the path lengths were identical. This was the first major error of the Michelson-Morley experiment.
Unfortunately, the experiment (in 1897) was doomed to failure, because the mechanics of it were not understood by Michelson & Morley, (or any later physicists.)
Summary of Actual Mathematics and Mechanics.
Note; This is simply an experiment in mechanics, and therefore all the laws of mechanics must be strictly adhered to.
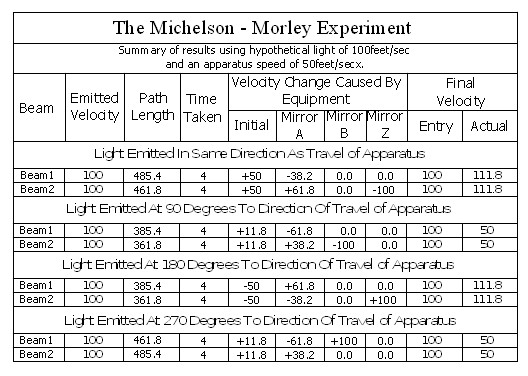
In the above chart ‘Emitted Velocity’ means the velocity that the light travels away from the light source.
Let us consider that the apparatus is travelling in the same direction as the light is emitted. Let us assume that the speed of light is 100feet/sec, and let us assume that the apparatus is travelling at 50feet/sec. I do this because using the actual figures leaves us with messy figures such as;
” T2 = (2 x 0.1 x 300,000.0015/300,000) x (1/300,000.0015)” – From Physics or Fantasy – Section 1. (It would also be difficult to get figures like this into the chart above.)
Beam 1

Within the apparatus the light would travel a distance of 400 feet in 4seconds, travelling from the emitter to Mirror A, then on to Mirror B and then passing through Mirror A again until reaching the Receiver.
However, whilst this is happening, the apparatus will have travelled 200 feet up the laboratory at a velocity of 50feet/second in the same 4 seconds.
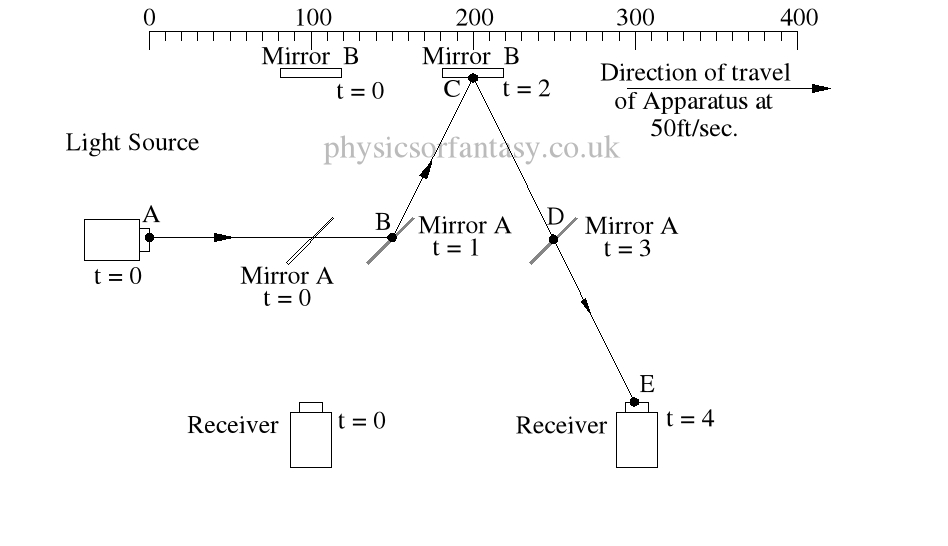 Ignoring the speed of the light and considering only the speed of the apparatus, the light must pass through the points B, C, D and E, after being emitted from point A, and at the times stated. The distance the light must travel to pass through these points is 485.4 feet. If the apparatus is moving at any speed relative to any point outside the apparatus, then the distance travelled relative to this external point must be greater or less than the path length within the apparatus, in our example 400 feet.
The light is emitted at time t = 0, and must arrive at point E because that is where the receiver will be at time t = 4secs.
The velocity of the light relative to its starting position (Or even a fixed point in space) will be 100 ft/sec emission velocity plus 50ft/sec (the velocity of the apparatus), but only until it strikes Mirror A.
Because Mirror A is moving away from the light, and is at 45° to direction of travel, the reflection of the light is, (according to the laws and mathematics of classical mechanics.) reduced to a velocity of 111.8 ft/sec. In other words the actual velocity of the light is reduced by 38.2 ft/sec.
Anyone who plays tennis, cricket, table tennis etc. will understand why this happens, without needing a degree in physics. A batsman facing a 100mph ball has various options. He can play a forward forcing shot (which will increase the speed of the ball) over the bowlers head, hopefully, for six runs. He can also move the bat backwards at the time of impact, which will reduce the speed of the ball. In both situations the angle of the bat also affects both the speed and direction of the ball.
Mathematics
Va = Velocity of Apparatus.
Ve = Emitted Velocity of the light.
mA = Mirror A, mB = Mirror B, mZ = Mirror Z.
PD = Physical distance between items of apparatus, example: PD(E>mA) = physical distance between emitter and Mirror A. This is 100ft in all cases in these examples.
TD = Travel distance of light between leaving one item and arriving at the next.
E = Light emitter.
R = Receiver.
Note: It is irrelevant whether you use feet, metres, miles, kilometres or Mega-miles as your units of measurement, if you remember to be consistent. This post is designed to investigate the validity of Einstein’s mathematics and logic.
Beam 1 – (E>mA)
This is the simplest part of the mathematics.
If the light is emitted at 100ft/sec. and the apparatus is travelling at 50ft/sec then the light must travel at 150ft/sec.
In 1sec. Mirror A will have travelled 50ft from a position 100ft in front of the starting position of the light.
In other words, in 1sec. Mirror A will be 150ft away from the starting position of the light.
If the light travelled a a constant speed of 100ft/sec, it would take 1.5 secs to arrive at the position that Mirror A was after 1 sec. However, it would still be 25 feet behind Mirror A.
Time taken from Mirror A to Mirror B.
Tan A = Actual distance moved by Mirror B, divided by the physical distance between Mirror A and Mirror B.
Tangent A = 50/100 = 0.5. Angle A is therefore 26.565°
TD = Cosine 26.565° = 100/X = 111.8 ft.
It must travel this distance in 1 sec. otherwise it it would miss mirror B. ( Note; Although the mirrors in my diagrams are shown as very wide, in actual practice the mirrors would be narrow, probably about 0.5 inches (12.5mm) wide).
The actual distance travelled by the light from light source to Mirror B is now 150 + 111.8 = 261.8ft. It has taken 2 seconds.
The light now has to travel from mirror B to the receiver R. The actual distance between mirror B and the receiver R is 200ft. However, the light has to travel a distance of 2 x 111.8 to arrive at receiver R.
It takes 2 seconds to travel this distance at a speed of 111.8ft/sec.
TD(E>R) = TD(E>mA) + TD(mA>mB) + TD(mB>E) = 150 + 111.8 + (2 x 111.8)
= 485.4ft
The average speed of the light is 485.4/4 = 121.35ft/sec.
It should be obvious that over a period of 4 seconds the light must strike mirror A then Mirror B, then Mirror A again, and finally the receiver R, at the times shown because that is where the items are at the times shown. The light beam must travel at the speeds shown to allow it strike the items.
Beam 2.
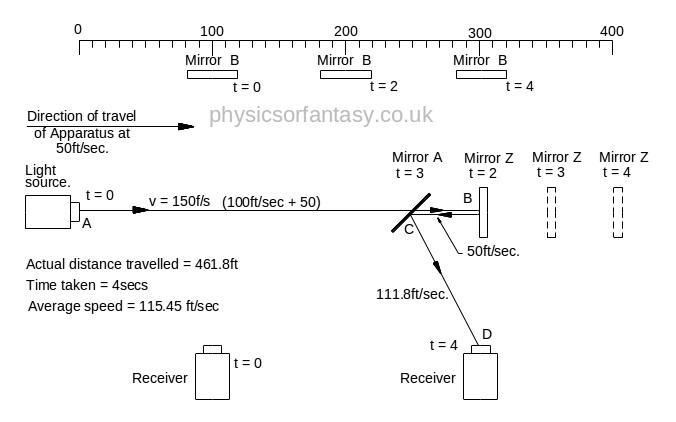
Beam 2 travels from the emitter E to Mirror Z, then back to Mirror B and then onto the Receiver R.
The path length (measured on the equipment) is 400ft.
Note: The light strikes mirror Z at a closing velocity of 100ft/sec, because mirror Z is moving away at 50ft/sec. The light reflection loses another 50ft/sec. because the mirror is still moving away at 50ft/sec.
The speed of the light reflection relative to mirror Z is 100ft/sec. Confusing isn’t it? But it is true. Cricketers, table tennis players, etcetera all use this fact whilst playing their games, and without a honours degree in physics or engineering. Although not an everyday problem in mechanics it does arise quite often in machinery design.
TD(E>mZ) = Time taken from Emitter E to Mirror Z.
= TD(E>mZ)/V2(E>mZ) = 300/150 = 2 sec.
DT(mZ>mA) = Time taken from Mirror Z to Mirror A.
= TD(mZ>mA)/V(mZ>mA) = 50/50 = 1 sec.
T(mZ>R) = Time taken from Mirror Z to Mirror A.
= T(mZ>R)/V(mZ>R) = 111.8/111.8 = 1 sec.
—————————————————
Notes on lack of time differences in the Michelson – Morley experiment.
If you place the experiment on a train and rotate it through 360° and measure the time taken for the light to travel from the emitter to the the receiver at various angular positions, no time differences will be detected.
——————————————–
If you are in a car travelling eastwards towards the rising Sun at a road speed of 100 mph, then your speed relative to the Sun (It being a ‘fixed point in the universe relative to us), would be approximately 1,100 mph. (The earth rotates at approximately 1000 mph.)
If later the same day on the same road and still travelling at 100 mph, but travelling in a westerly direction towards the setting sun, your speed relative to the sun would be approximately minus 900 mph. Therefore your speed relative to the sun would have changed by 2000 mph, (i.e. from +1100mph to -900mph.) in the 12 hours between the two journeys.
——————————-
If you replace the car with a beam of light and carry out similar timings the light will actually be travelling at c + 1000 mph when travelling towards the sunrise, and c-1000mph when travelling towards the sunset, ( c = The claimed constant speed of light.) The velocity of the light (Relative to the Sun) changes by 2000mph between these
Let us change our apparatus to a tube 300,000 kilometres long (approximately). Inside this tube there is a light transmitter(A) at one end and a light receiver(B) at the other end. We set this tube travelling towards the sun, with end B at the leading end, at a speed of 300,000 kps. When B is at a distance of 300,000 kilometres from the sun we fire the light emmitter at A, towards B (the receiver). One second later end B hits the sun at exactly the same time as the light hits (B). At the time (A) is triggered it is 600,000 kilometres away from the sun.
During this one second the light has travelled 600,000 kilometres and this light has travelled at twice the speed of light!
If we had reversed the tube so that A was at the front end and carried out the same procedure, the light would travel from A to B in two seconds. (end B is still 300,000 kilometres from the sun when end A hits the sun). The light still travels the length of the tube in one second but to an outside observer the light front would be static whilst the end B would be travelling at 300,000 kps towards the light front.
It is this aspect of the Michelson – Morley Experiment that confuses the physicists (plus one or two trigonometry mistakes.)
The man plus the train, the car plus the road, are just different versions of the Michelson – Morley experiment.
Author – Brian Williams
-
Goethe’s Colour Spectra.
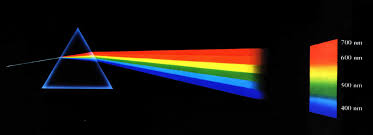
Posted on November 8th, 2014 No commentsYesterday, 7th November 2014 I was searching Google Images for suitable photographic images to add into my post “Williams’ Pin Prism, and Fraunhofer Lines.”. This was not an easy task because most images do not show the true visual evidence and are more computer graphics than reality. However, the task was definitely worthwhile, because I came across an image originally produced by Johann Wolfgang von Goethe. (1749 – 1832)
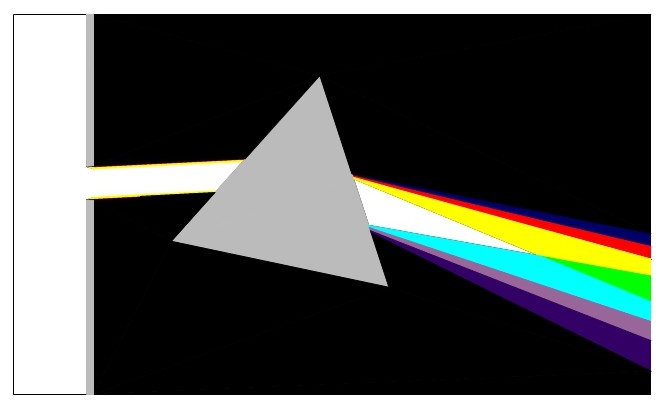
Most modern images are similar to the ones below.
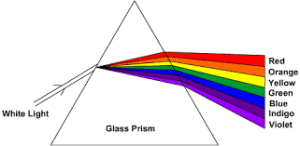

These images are totally against the reality of what happens with prism spectra, and I find it very annoying , especially when being used to teach people.
Note; I have been sent this video clip from a reader who asked me to explain it.
http://www.youtube.com/watch?v=7Fl0GZsBhGo&NR=1
I am afraid that the contents of it demonstrate the poor teaching and lack of honesty in modern physics.
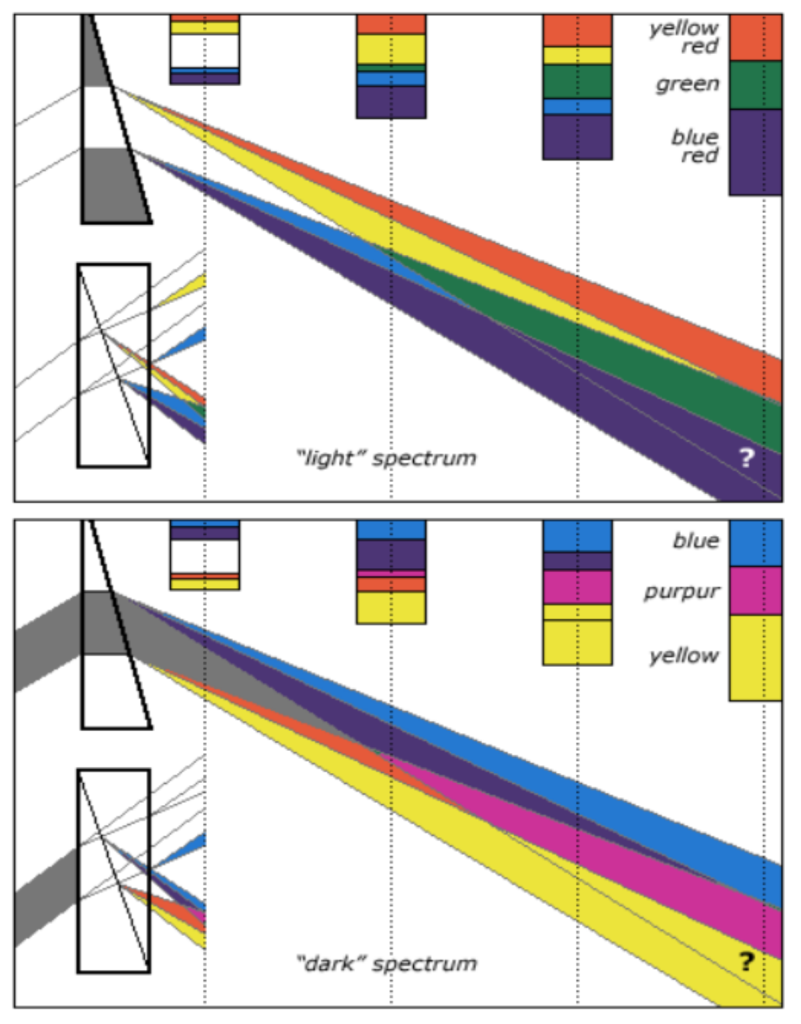
The drawings below, originally created by Goethe. and re-created by www.handprint.com are very close to the actual/true situation. His method/style used is identical to that used by myself, so he definitely beat me to it.
 handprint : goethe’s “zur farbenlehre” www.handprint.com380 × 555Search by image
“light” and “dark” spectral mixtures from. Goethe’s “primordial” fringes adapted from Plate IV, Figures 1 and 2 and ¶214-¶216 of Zur Farbenlehre (1810)
I assume that the above colours are based on the actual colours seen in the original book, which will have faded. In the top picture the Green shown should be a very bright Green.
The lighter Blue should be Cyan.
Where the question mark is, this area should be a dark Green.
The top picture (“Light” spectrum) is what I refer to as an “Expansion Spectrum”.
The bottom picture (Dark” spectrum) is what I refer to as a “Compression Spectrum”.
In this picture, where the question mark is, this area should actually be very pale Mauve or White. “Purpur” should actually be Magenta. Magenta only occurs in compression spectra and Greens only occur in expansion spectra.
Note; It is the slit, (that constricts the light into a beam), that actually creates the colours. The White beam entering the prism has thin Yellow + Red + Blue edges to it. This is why the colours start at edge of the spectra exiting the prism, as shown in the above drawings. What is missing from the top drawing is the dark Blue band. Its energy is measurable and is named “Infra Red” due to lack of knowledge, by the physicists. It is missed because this ‘true’ spectra Blue is very dark and is ‘lost’ against the dark background. The lighter Blues are a mixture of either Blue and White or Blue and Red.
In the drawing below, the left hand side (White) is the source of the light. This light passes through an aperture (Slit) and shines onto the prism.
 In passing through aperture, narrow coloured edges are created on each side of the beam of light. These edges are composed of three colour bands, Blue on the outer edge, Red in the middle and Yellow on the inside These edges are created by the Laws of Fluid Mechanics. If you look under “Orifices” in your text book on Fluid Mechanics, all should be explained.
See also my “Taper Slit Experiment” and my “Taper Silhouette Experiment.
Author – Brian Williams
-
Williams’ Pin Prism, and Fraunhofer Lines.
Posted on November 5th, 2014 No commentsI am sorry, but the spectroscope does not indicate any atomic information about a material. As a comparator it is a very useful tool but only in tightly controlled conditions.
It does not tell you the atomic structure of a distant object, nor does it tell you the atomic structure of an object held within the spectroscope equipment itself.
The Pin Prism.
I carried out these experiments in 1990. My idea was to look at the mechanics of the prism. I know that most people will say that a prism is just a triangular piece of glass and that a slit is just a rectangular hole but, individually, they change light. The slit creates the colours and the prism creates the spectrum. Working together, they become a mechanism.
Basically, the Pin Prism is (was, the water rapidly destroyed it) a triangular array of pins. The original one consisted of brass ‘panel pins’ hammered into a plastic coated plywood board. The array quality was rather erratic because hammering pins into this material is very difficult when trying to get them at 3mm centres. There were other problems in getting the experiment working, but I will discuss them later. (Note; I carried out similar experiments with a ‘Pin Lens’ and a ‘Pin Sheet’ that also gave quite good results considering the poor quality of the equipment.) Note; You obviously do not need to spend £millions of public money to carry out physics research.
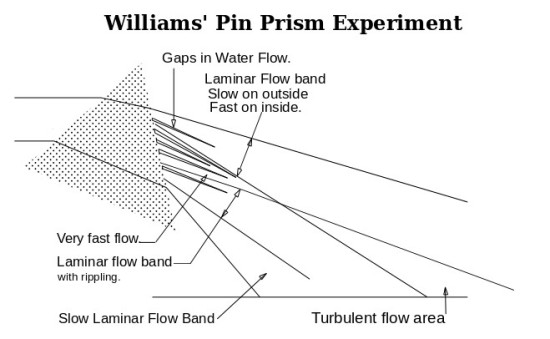
Most of the results roughly matched the comparison with the light experiments i.e. where the ‘Yellow and Cyan ‘ bands overlapped the water was very turbulent, and the ‘Yellow and Red’ areas plus the ‘Blue’ areas were fairly smooth.
However, I finally noticed that were various gaps in the flow. Initially I was just intrigued and carried on experimenting, varying the flow rates and noting what happened. I noticed that the gaps lengths extended with increase in flow rate.
As the flow rate dropped the gap diminished until it disappeared. As the flow reduced even more, a ‘ridge’ formed, caused by the water that was originally on both sides of the gap combining. Therefore the water flow changed from a gap to a ‘pressure ridge’.
With a fixed experimental set-up with light, if we start off with a high energy light source, sufficient to produce black lines in the spectrum, and slowly reduce the energy , the gaps in the flow (black lines) will reduce in width and length until the gaps (black lines) disappear.
If we continue reducing the energy level, bright lines will develop to replace the dark lines. If the original black line was in an area of the spectrum that was red, then a brighter red line would develop.
What causes the gaps in the spectrum on which so much physics research is based?
The answer is, the same mechanics that cause the gaps in the pin prism. The water flowing through the pin prism follows a very complex path. On entering the prism it is split into a number of streams by the first pins. Whilst passing through the prism it is split or combined on numerous occasions before exiting the prism.
If the angle at which the water enters the pin prism is constant then the paths followed by the individual streams will tend to be constant.
The speed of any particular stream of water will depend on the energy loss due to the length of the path taken.
With light the same mechanics apply. The atoms of glass act like the pins in the pin prism. The various streams of light are split or combined thousands of times before the light exits the prism.
See also “Goethe’s Colour Spectra”
Author – Brian Williams
Abstract from Physics or Fantasy – Section 2 – Colour and The Quantum Theory