-
Colour Test Bars
Posted on October 13th, 2010 No commentsThe drawing below is one I originally produced some 15 years ago as a cross-check on my theory that the spectrum colours originate from edges. It turned out to give quite a large quantity of information that confirms my theory.
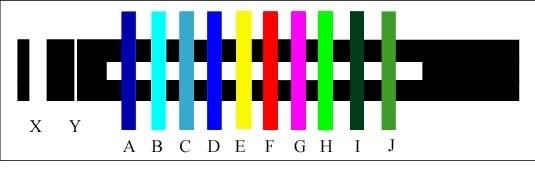
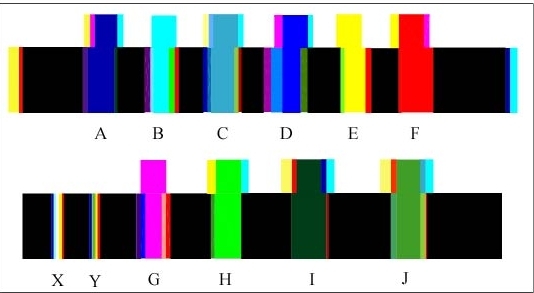
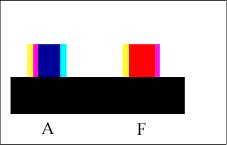
Test Bars 1A
Viewing different areas of the above through a prism gives you the various spectra shown below. I have tried 60°, 45° and 30° prisms and find that a 45° prism gives the best overall results. It is also the most readily available, from old cameras and binoculars.
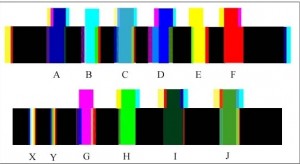
At first the spectra below don’t seem to make much sense. However, if you bear in mind my previous pages it all starts to make sense. Note that I cannot guarantee the colour accuracy on your monitor or printer, I have had difficulties producing the colours actually seen, and some of the colours are definitely “off colour”. In practice you will probably see some faint strips that I consider to indicate that there is another colour in the pigment or being projected.
Note: The viewing distance between the screen and the prism affects the width of the bands.
It should be remembered that we are dealing with energy levels. A black screen radiates approximately 4.5% of the energy of a White screen, so that this may partly explain the less prominent colour bands, as it is produced from Cyan/Blue, Magenta/Red and Yellow/Green phosphors.
The next 3 sketches explain the colour bands on silhouettes of Blue, Red and Yellow.
It should be noted that a higher energy colour will encroach into part of the space occupied by a lower energy colour.
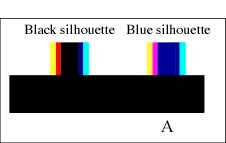 With a black silhouette, (Black being an absence of any colour energy) the Blue light dissipates readily into this area, which sometimes makes it difficult to see. Some Red may also encroach into this area.
In the Blue silhouette the Blue band becomes part of the silhouette that is radiating the same energy level. The energy gradient from White to Blue is less than the energy gradient from White to Black therefore there is no separate Blue band. The Red band encroaches on the Blue area creating a turbulence we perceive as Magenta.
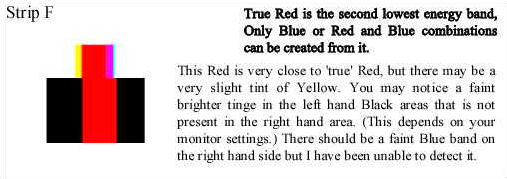
 With the Red silhouette the energy gradient is less therefore we lose the Red band.
The Cyan band merges into the Red area creating a turbulent mixture we see as Magenta. The Red band is part of the Red silhouette, which leaves us with a Yellow band.
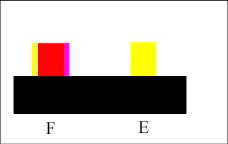 With the Yellow silhouette the energy gradient is only one step, i.e. White to Yellow; therefore there are no intermediate colour bands.
Magenta and Cyan.
Now let us consider the ‘oddball’ colours, Magenta and Cyan. Both of these, as silhouettes, give a clean strip without any side bands when viewed through the prism. (Note: There are some very narrow bands but I consider that these are caused by carry-over from the screen phosphors.)
This is due to the high turbulence between White and the Blue in both Magenta and Cyan. The eye/brain cannot accurately determine the ratios of colours due to the fluctuating energies, but is aware of which section of the cones the signals are coming from, and the brain decides that fluctuating energy in the Blue area of the cones plus White light gives us Cyan, and that fluctuating energy in the Blue and Red areas of the cones plus White light gives us Magenta.
Without the high proportion of the White light, the brain can handle the fluctuations giving us Purples, Mauves etc. in various hues.
 Screen or printed colours are a problem. I have not yet been able to reproduce the actual colours obtained from edges and prisms. The White intensity does not affect the primary colours Yellow, Red and Blue. Nor does it affect Cyan and Magenta. I have checked this using a White intensity three times greater than the screen White without any perceived difference.
It does affect the width and intensity of other colour band combinations. There should be no Yellow in the Magenta but Magenta has approximately the same energy level as Yellow.
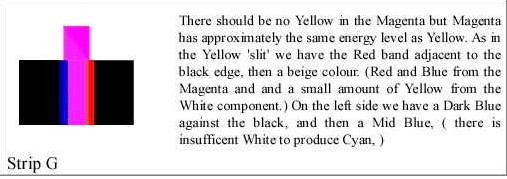
As in the Yellow ’slit’ we have the Red band adjacent to the black edge, then a beige colour. (Red and Blue from the Magenta and and a small amount of Yellow from the White component.) On the left side we have a Dark Blue against the black, and then a Mid Blue, ( there is insufficient White to produce Cyan. )
The use of these test bars gives us a method of accurately determining ‘True’ colours and also giving an accurate specification for any colour. At present there are no reliable standards for colours. You can compare colour charts from all sources without getting a match for a stated colour. It also gives us a more reliable method of measuring colour blindness.

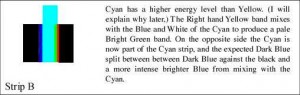
Blue Slit
Red Slit

Yellow Slit
Obviously my method of using the computer monitor as the colour source only gives approximations. As a pensioner I am unable to spend £millions on buying equipment. My total outlay on scientific equipment for this series of experiments was under £5.00.
The extra energy added to the colours due to the radiated Black screen energy of 1.5 micro amps made a serious distortion in the colours, particularly the Blues.
Author – Brian Williams